Evolutionary Coupling Analysis
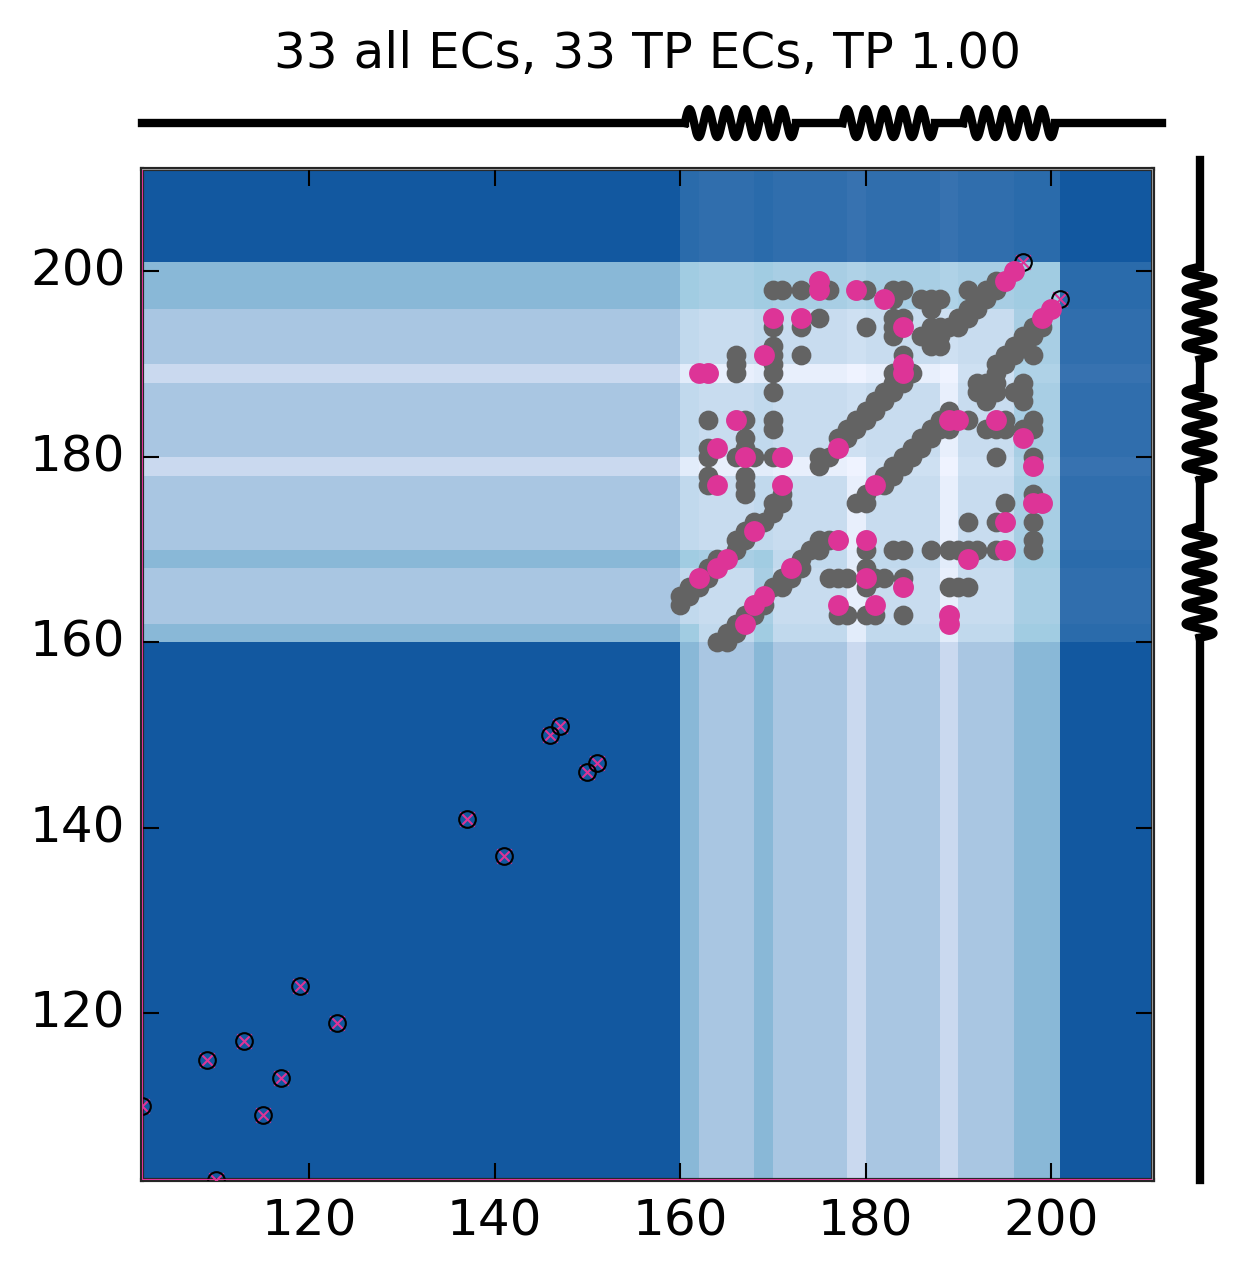
Predicted and experimental contacts
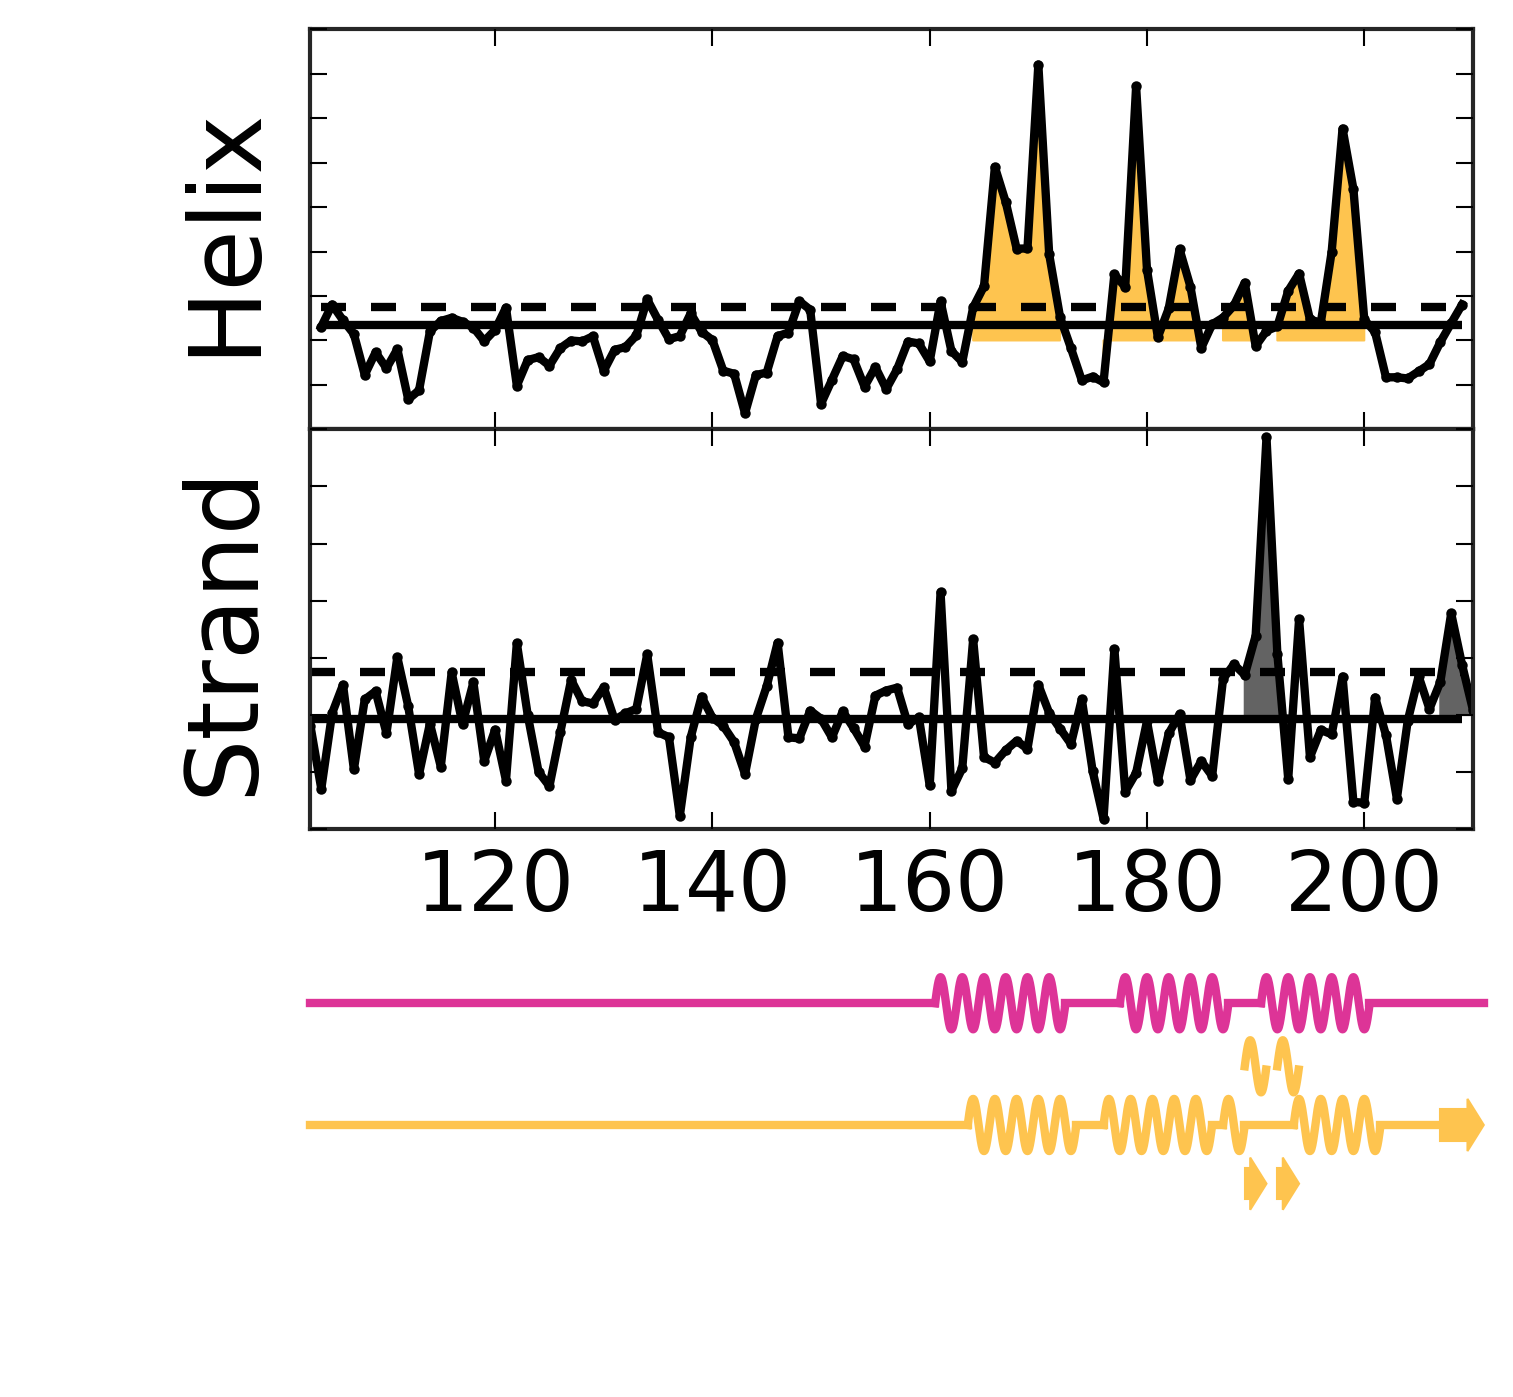
Secondary structure from ECs
EC score distribution and threshold
Top ECs
| Rank |
Residue 1 |
Amino acid 1 |
Residue 2 |
Amino acid 2 |
EC score |
| 1 |
177 |
R |
181 |
V |
1.13 |
| 2 |
196 |
E |
200 |
T |
0.91 |
| 3 |
164 |
E |
168 |
T |
0.87 |
| 4 |
168 |
T |
172 |
S |
0.87 |
| 5 |
171 |
M |
177 |
R |
0.86 |
| 6 |
173 |
M |
195 |
V |
0.71 |
| 7 |
197 |
Y |
201 |
G |
0.66 |
| 8 |
170 |
I |
195 |
V |
0.66 |
| 9 |
171 |
M |
180 |
V |
0.63 |
| 10 |
175 |
Y |
198 |
L |
0.61 |
| 11 |
184 |
L |
189 |
N |
0.59 |
| 12 |
175 |
Y |
199 |
L |
0.54 |
| 13 |
167 |
L |
180 |
V |
0.54 |
| 14 |
179 |
R |
198 |
L |
0.53 |
| 15 |
162 |
E |
189 |
N |
0.51 |
| 16 |
164 |
E |
177 |
R |
0.50 |
| 17 |
109 |
S |
115 |
P |
0.48 |
| 18 |
119 |
R |
123 |
S |
0.47 |
| 19 |
195 |
V |
199 |
L |
0.47 |
| 20 |
184 |
L |
194 |
A |
0.46 |
| 21 |
102 |
S |
110 |
G |
0.46 |
| 22 |
165 |
T |
169 |
E |
0.45 |
| 23 |
113 |
H |
117 |
A |
0.44 |
| 24 |
164 |
E |
181 |
V |
0.44 |
| 25 |
137 |
V |
141 |
V |
0.43 |
| 26 |
166 |
M |
184 |
L |
0.43 |
| 27 |
146 |
S |
150 |
E |
0.43 |
| 28 |
169 |
E |
191 |
P |
0.42 |
| 29 |
162 |
E |
167 |
L |
0.42 |
| 30 |
147 |
S |
151 |
E |
0.41 |
| 31 |
182 |
A |
197 |
Y |
0.41 |
| 32 |
163 |
Y |
189 |
N |
0.41 |
| 33 |
184 |
L |
190 |
N |
0.40 |
Alignment robustness analysis
First most common residue correlation
Second most common residue correlation